Range of Scores on IQ Tests: What Is the Meaning of IQ Scores and IQ Test Levels?
What does the number on your IQ test mean? How accurate are these numbers? If you have questions like these about IQ scores, we discuss them in this comprehensive guide. Learn how to interpret your IQ score confidently, understand the facts behind IQ calculations, and discover what these numbers on the chart mean for your life.
Back
10 mins read
Intelligence Quotient (IQ) tests have long been a cornerstone in measuring cognitive abilities, but understanding what your score actually means can be a bit of a puzzle. With terms like "IQ scale," "IQ test levels," and "IQ chart" floating around, it's easy to get confused.
Typically, IQ score ranges from below 70 to above 145, spanning a spectrum from intellectual disability to genius-level cognition. But what does this mean for you?
Knowing your IQ score isn't just about having a number to brag about (or worry over). It's about gaining insight into your cognitive strengths (as well as cognitive health) and identifying areas where you might benefit from extra support or challenge. Whether you've scored in the average range (85-115) or find yourself at one of the extremes, understanding your IQ can be a powerful tool for personal growth and self-awareness.
This article will explain the different IQ test levels and ranges, IQ bell curve, and the IQ test ranges often seen on the most popular IQ tests. We'll clear up common misconceptions and give you a straightforward guide to understanding IQ ranges.
Whether you want to know more about your cognitive abilities, understand a child's IQ and mental ability, or are just curious about the science of human intelligence, this is the right place. Let's decode the meaning of IQ numbers and discover how they offer valuable insights into the human mind.
What Does IQ Test Score Ranges Mean?

To truly grasp the meaning of IQ test score ranges, we must understand how IQ testing is structured and interpreted. How exactly are these comparisons made?
Imagine you're at a big family gathering and decide to play a game to see how everyone stacks up in height. You line up everyone from the shortest to the tallest.
You'll probably notice that most people are around the same height, with just a few very short and very tall family members. In statistics, this pattern of most people being around the middle and fewer at the extremes is called a Bell Curve. It also applies to IQ score ranges.
What Is the Bell Curve for IQ Scores?
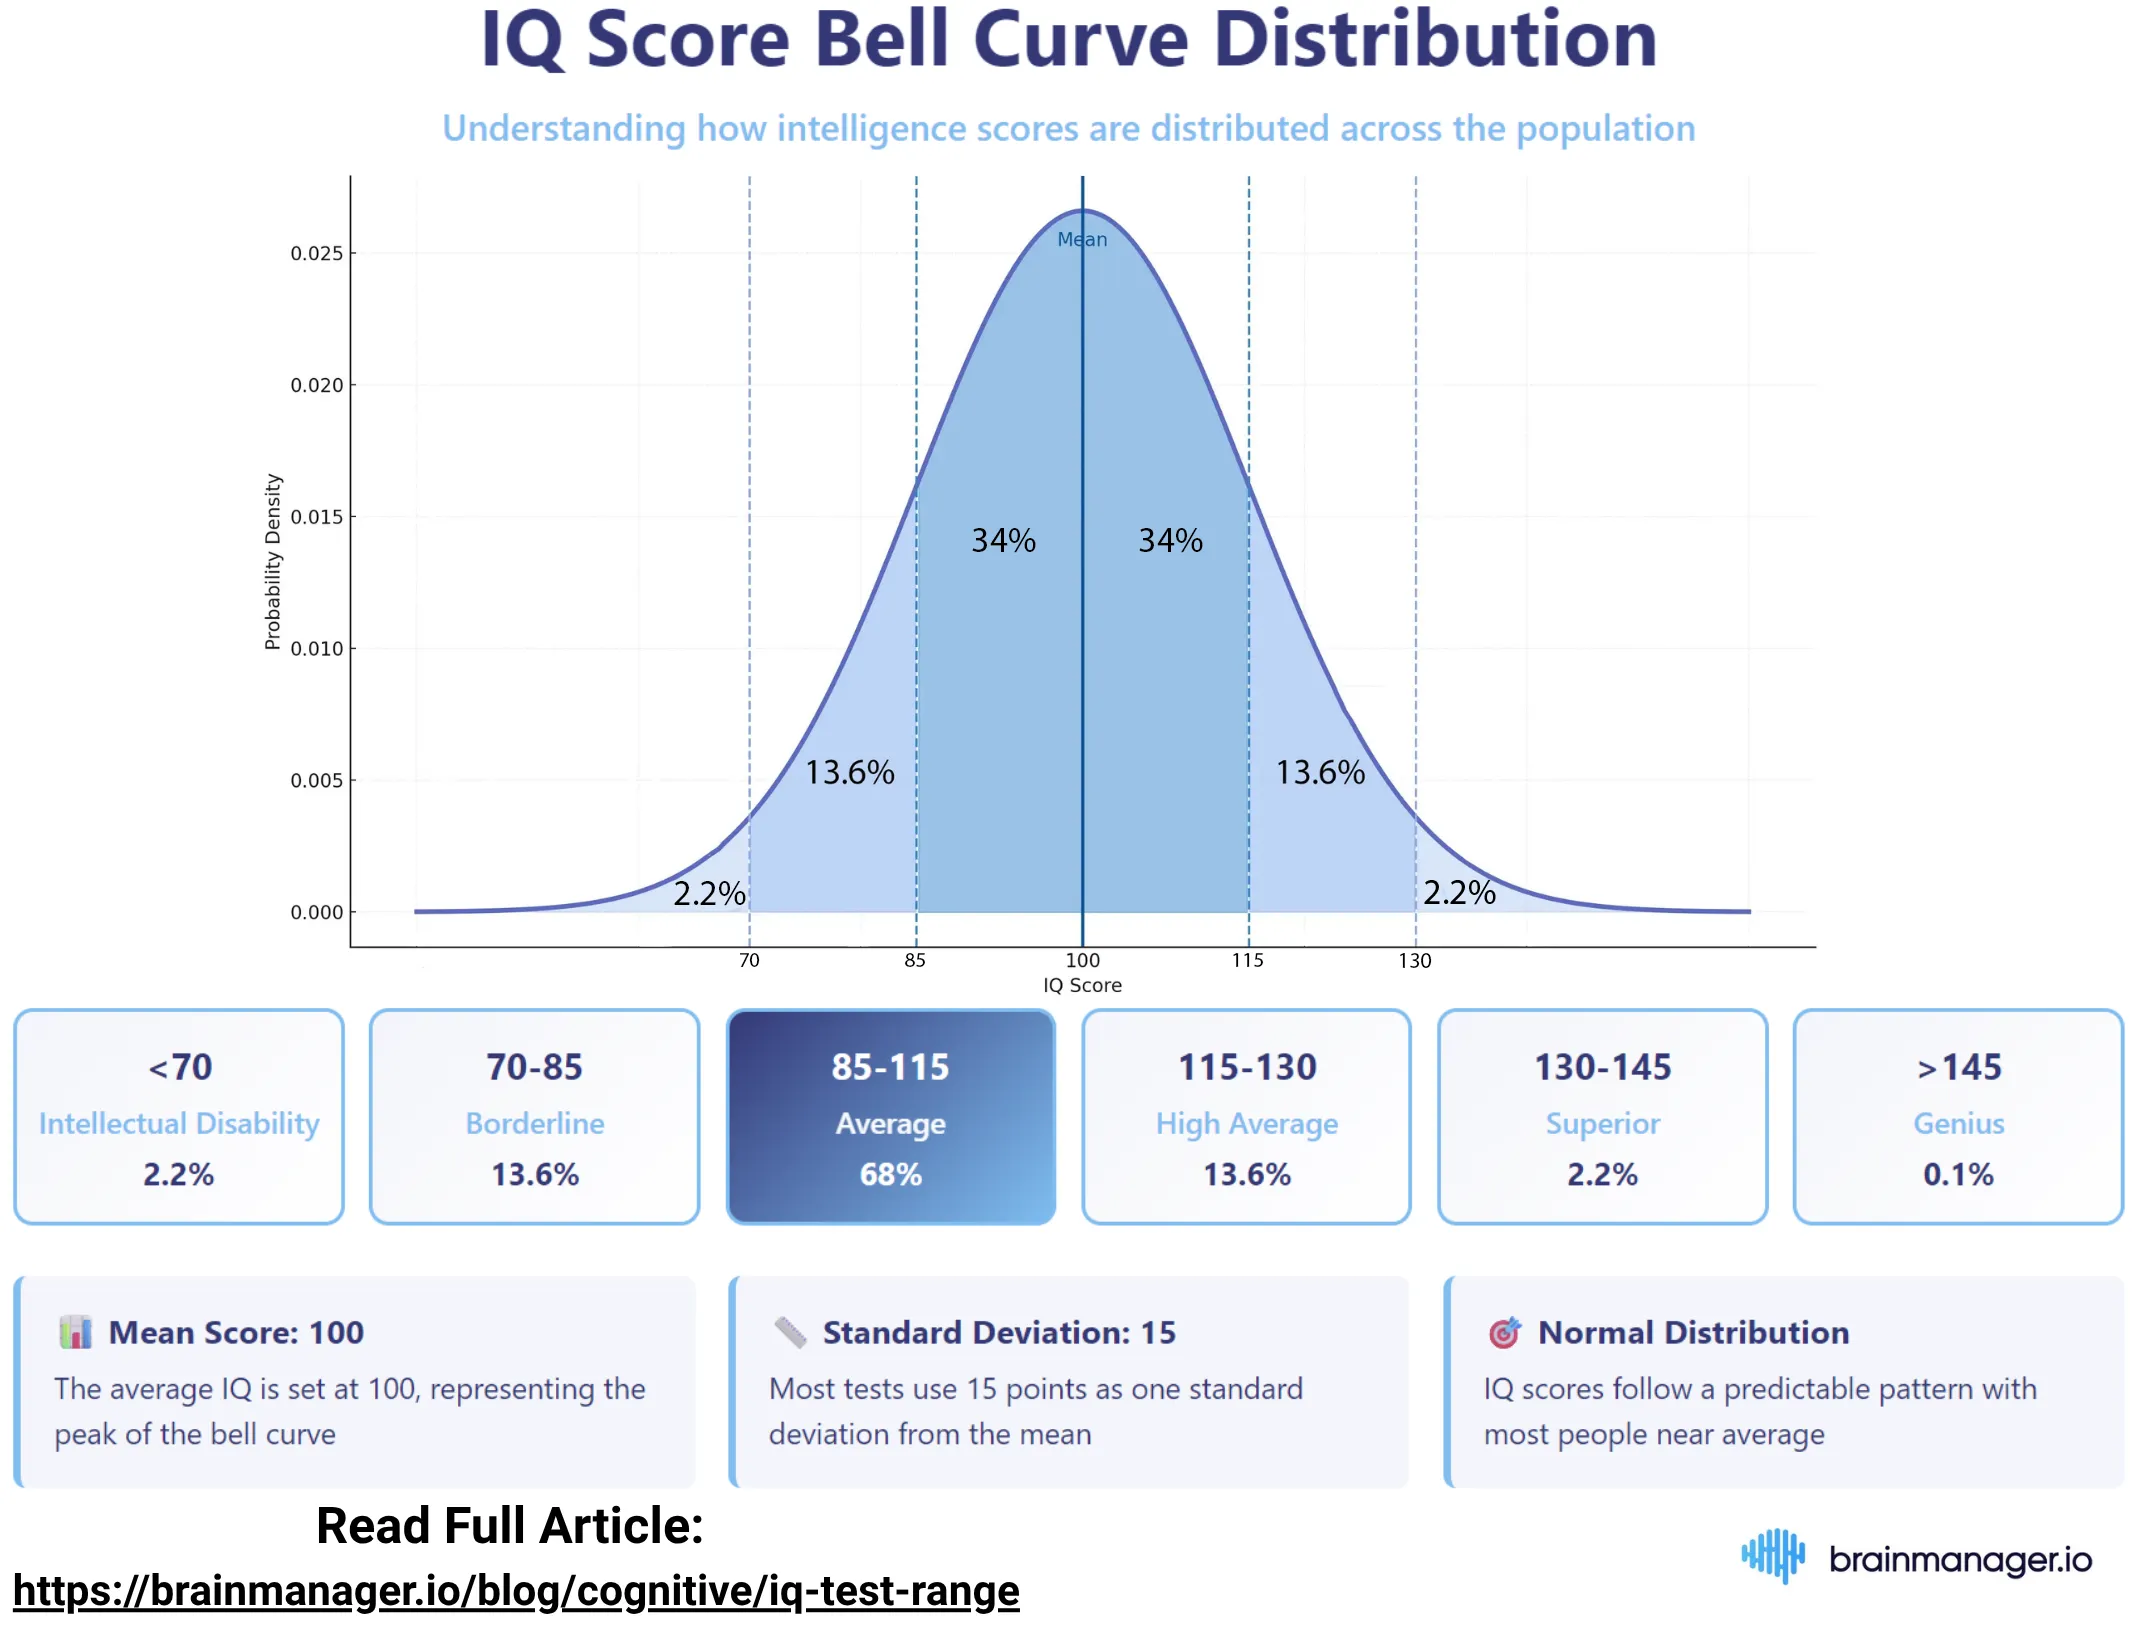
The bell curve, also known as the normal distribution, shows how scores (like IQ scores) are spread out across a group of people. Plotting these scores on a graph forms a shape like a bell – hence the name.
This curve helps us understand where someone falls in relation to the general population. For example, a person with an average IQ falls near the center of the curve, while someone with a very high or very low IQ would be at one of the curve's extremes.
Here's how it breaks down:
- Average (Mean) IQ: Imagine the bell curve's peak is your family members' average height. For IQ scores, the average (mean) is set at 100. This is where most people's scores cluster.
- Standard Deviation: This is like saying, "Most of our family members are about this much taller or shorter than the average." For IQ scores, the standard deviation is 15 points. This means most people (about 68%) have IQ scores between 85 and 115.
Think about the IQ bell curve like this:
- Middle of the Curve: Just like most of your family members are of average height (if your family plays in the NBA, this might not apply... lol), most people have average IQ scores, around 100.
- One Standard Deviation: Moving out from the middle, you still see many people, but fewer than at the very peak. In terms of IQ, this range (85-115) covers about 68% of the population.
- Two Standard Deviations: Now, you're seeing even fewer people. For IQ, this range (70-130) includes about 95% of people.
- Three Standard Deviations: Finally, at the far ends of the curve, you see just a few very tall and very short family members. For IQ scores, only about 0.3% of people score below 55 or above 145.
Why the Bell Curve Matters in Understanding Your IQ Score
Understanding the bell curve helps you see where your IQ score fits compared to everyone else:
- If your score is around 100, you're in company with the majority of people.
- A score above 115 means you're higher than about 84% of people.
- A score below 85 means you're lower than about 84% of people.
This visualization helps you understand that having a high IQ or low IQ score doesn't make you better or worse – it just means you're at a different point on the curve.
It's important to note: Just like not everyone in your family is the exact same height, not everyone has the same IQ. Most people are clustered around the average, with fewer people at high and low ends. The bell curve is a simple way to show this distribution and helps you see where you stand in relation to the wider population.
IQ Test Levels: Baseline Numbers and Ranges

Now that we've covered the basics of how IQ distribution works let's look at what different IQ ranges actually mean. IQ test levels vary from intellectual disability (below 70) to borderline intelligence (70-85), average (85-115), high average (115-130), superior (130-145), and very superior/genius (above 145).
Understanding these levels can help you make sense of IQ test scores and what they suggest about cognitive abilities. Keep in mind that most IQ tests use a scale with an average score of 100.
IQ Chart: Scores and Classifications Based on Normal Distribution
| IQ Range | % of Population | Classification | What It Means |
|---|---|---|---|
| Below 70 | 2.2% | Intellectual Disability | Significant challenges in learning and daily functioning. |
| 70-85 | 13.6% | Borderline | Below-average cognitive abilities; may face some learning difficulties. |
| 85-115 | 68% | Average | Typical cognitive abilities for most of the population. |
| 115-130 | 13.6% | High Average | Above average cognitive skills; often quick learners. |
| 130-145 | 2.2% | Superior | Highly developed cognitive abilities; often considered gifted. |
| Above 145 | 0.1% | Very Superior/Genius | Exceptional cognitive abilities; rare in the general population. |
It’s important to remember that these IQ ranges are general guidelines. You can find slightly different numbers and ranges online depending on the source and specific IQ test (more on that later, so read on!).
Also, intelligence scores are just one measure of your cognitive ability and don't capture the full picture of a person's intelligence or potential, debunking the IQ myth that these scores define your overall intellect.

Interpreting Test Scores Across Cultures
When interpreting IQ test scores across cultures, it’s essential to consider the context in which the test is given. For instance, in countries with low IQ scores, results often reflect disparities in access to education, nutrition, and other environmental factors rather than innate cognitive abilities.
These cultural and socio-economic differences highlight why IQ results should be viewed as part of a broader framework rather than as definitive measures of potential or ability.
Breaking Down IQ Score Ranges: What Do IQ Test Levels Mean?

Understanding the different ranges of IQ scores can provide valuable insights into an individual’s cognitive strengths and challenges. Each level represents a unique set of abilities, helping us better appreciate the diversity of human intelligence.
While the chart above provides a quick overview, let’s take a closer look at what each IQ level means and the characteristics commonly associated with these ranges:
- Intellectual Disability (Below 70): People in this range often need additional support in learning and daily life. It's important to note that IQ tests aren't always the best measure for individuals with intellectual disabilities, as they may have strengths in areas not captured by traditional IQ tests.
- Borderline (70-84): This range indicates below-average cognitive abilities. Individuals in this range might face some challenges in academic settings but can often lead independent lives and succeed in various careers.
- Average (85-115): Most people fall into the average IQ range, which represents a wide spectrum of abilities and potential. Remember, getting an average IQ score doesn't mean lacking intelligence – it simply reflects typical cognitive abilities compared to the general population.
- High Average (116-129): People in this IQ range often excel in academic settings and may find complex problem-solving comes naturally to them. High-IQ individuals typically have strong verbal and numerical reasoning skills.
- Superior (130-144): This range is often associated with giftedness. Individuals in this range usually have exceptional problem-solving abilities and may excel in fields requiring high cognitive function.
- Very Superior/Genius (Above 145): Scores in this range are rare, occurring in less than 1% of the population. People with genius IQ scores often have extraordinary cognitive abilities and may significantly contribute to their fields.
The Relativity of IQ Test Scores
After understanding the bell curve and how IQ scores are distributed, it's also important to note that IQ scores are relative, not absolute. They don't measure an intrinsic, fixed quantity of intelligence. Instead, they indicate how an individual's performance compares to others of the same age group who took the same test.
Think of IQ scores like grades on a school test. Scoring 90% on one test might mean an A, but on another test, it could be a B, depending on how the rest of the class performed. Similarly, an IQ score shows where you stand relative to the average performance of your age group.
This relativity is why IQ tests are periodically re-normalized. As populations change and overall performance on these tests improves (a phenomenon known as the Flynn effect), the tests must be adjusted to maintain the 100 average. This ensures that an IQ score of 100 always represents average intelligence, even as our collective cognitive abilities evolve.
Why Different IQ Tests Yield Different Ranges
Different tests can show slightly different ranges due to variations in their design, scoring systems, and statistical parameters. This means that an IQ score on one test may not be directly comparable to a score on another test, even if the numerical values seem similar. Let's take the WAIS and Stanford-Binet tests, for instance.
The Wechsler Adult Intelligence Scale (WAIS) uses a standard deviation of 15 points and is designed to follow a normal distribution. This means most people score between 85 and 115 on this test.
However, the Stanford-Binet test uses a standard deviation of 16 points, slightly shifting the distribution. The larger standard deviation (16 points) on the Stanford-Binet test means the scores are more spread out.
Because the distribution is slightly more spread out, individuals who score at the higher or lower ends of the scale might have their scores slightly elevated or lowered compared to how they would score on the WAIS. For example, someone at the high end might score a bit higher on the Stanford-Binet than they would on the WAIS.
The Different Ranges Across Different IQ Tests

Whether you're interpreting results from the Wechsler Adult Intelligence Scale (WAIS), the Stanford-Binet Intelligence Scales, or other popular assessments like the Raven's Progressive Matrices or the Wonderlic Personnel Test, it's crucial to know how these scores are categorized.
Let's see the ranges on the most popular IQ tests:
Stanford-Binet Intelligence Scales (SB-V)
The Stanford-Binet test has a score range from 40 to over 160, with a mean of 100 and a standard deviation of 16. This broader standard deviation results in a wider spread of scores, making it slightly different from other tests. Here's how to interpret the results:
- Severely Impaired/Delayed: Below 40
- Moderately Impaired/Delayed: 40-54
- Mildly Impaired/Delayed: 55-69
- Borderline: 70-79
- Low Average: 80-89
- Average: 90-109
- High Average: 110-119
- Superior: 120-129
- Gifted/Very Superior: 130-144
- Genius/Exceptional: 145 and above
Wechsler Adult Intelligence Scale (WAIS-IV)
The WAIS-IV ranges from 40 to 160, with a mean of 100 and a standard deviation of 15. This is one of the most commonly used IQ tests for adults. Here's what the results mean:
- Extremely Low: Below 70
- Borderline: 70-79
- Low Average: 80-89
- Average: 90-109
- High Average: 110-119
- Superior: 120-129
- Very Superior: 130 and above
Wechsler Intelligence Scale for Children (WISC-V)
The WISC-V, also designed with a mean of 100 and a standard deviation of 15, is used to assess children, with scores ranging from 40 to 160. Here's the WISC-V range:
- Extremely Low: Below 70
- Borderline: 70-79
- Low Average: 80-89
- Average: 90-109
- High Average: 110-119
- Superior: 120-129
- Very Superior: 130 and above
Raven's Progressive Matrices
The Raven’s Progressive Matrices test typically ranges from 60 to 145, with a mean of 100 and a standard deviation of 15. This test is known for its focus on abstract reasoning. Here's the range:
- Low: Below 85
- Average: 85-115
- High: Above 115
Cattell Culture Fair Intelligence Test (CFIT)
The CFIT has a score range from 60 to 145, with a mean of 100 and a standard deviation of 16, making it similar in spread to the Stanford-Binet but designed to be less culturally biased. Here's its IQ range:
- Low: Below 85
- Average: 85-115
- High: Above 115
Kaufman Assessment Battery for Children (KABC)
The KABC ranges from 40 to 160, with a mean of 100 and a standard deviation of 15. It is designed to assess the cognitive development of children. Here's its range:
- Low: Below 90
- Average: 90-109
- High Average: 110-119
- Superior: 120-129
- Very Superior: 130 and above
Woodcock-Johnson Tests of Cognitive Abilities
The Woodcock-Johnson test has a range from 40 to 160, with a mean of 100 and a standard deviation of 15, similar to the WAIS and WISC. Your result can be:
- Low: Below 90
- Average: 90-109
- High Average: 110-119
- Superior: 120-129
- Very Superior: 130 and above
Differential Ability Scales (DAS)
The DAS, with a range of 40 to 160, also has a mean of 100 and a standard deviation of 15. It is widely used in educational settings. Here's its range:
- Low: Below 90
- Average: 90-109
- High Average: 110-119
- Superior: 120-129
- Very Superior: 130 and above
Wonderlic Personnel Test
The Wonderlic test scores range from about 10 to 50, with a mean of around 20-24, which corresponds to an IQ of 100, and an estimated standard deviation of 7-8. Here's how to interpret your results:
- Low: Below 10
- Average: 20-24
- High: 25 and above
Understanding IQ Scores Across Different Tests
Each of these intelligence tests has its own scoring system and interpretation, but most are based on a mean of 100 with a standard deviation of 15 or 16. This categorizes individuals into ranges that help understand their cognitive abilities relative to the general population.
Other tests might use different means or standard deviations, affecting score interpretation.
Understanding these differences is crucial when comparing IQ charts across different intelligence tests. For instance, an IQ score of 130 on the Wechsler Intelligence Scale differs slightly from a 130 on the Stanford-Binet test due to the difference in standard deviation.
So, what does this mean for you? If you've taken IQ tests and visualized your score on a chart, it's essential to know which intelligence test was used and the specific parameters it follows. This will help you understand where you truly stand and how your score compares to others.
In essence, IQ test performances are a helpful tool for gauging cognitive abilities, but they should be viewed as part of a broader picture. They're relative measures that can provide insights into strengths and areas for development but aren't definitive assessments of your potential or worth.
Interpreting IQ Scores: Beyond the Numbers

Understanding IQ scores involves more than just looking at a number. It's about recognizing what that number signifies in the context of cognitive abilities and potential. As we've discussed, IQ tests provide a relative measure of intelligence, comparing cognitive performance across different age groups and populations.
However, it's essential to remember that an IQ score is not a definitive measure of your abilities or potential. It's a snapshot of certain cognitive skills at a specific point in time. Many factors, including education, environment, personality traits such as resilience, and even test conditions, can influence your score.
For instance, IQ tests designed for adults, like the Wechsler Adult Intelligence Scale (WAIS), may yield different insights than those developed for younger individuals, such as the Stanford-Binet scale for children. These variations highlight the importance of understanding each test's specific context and target group.
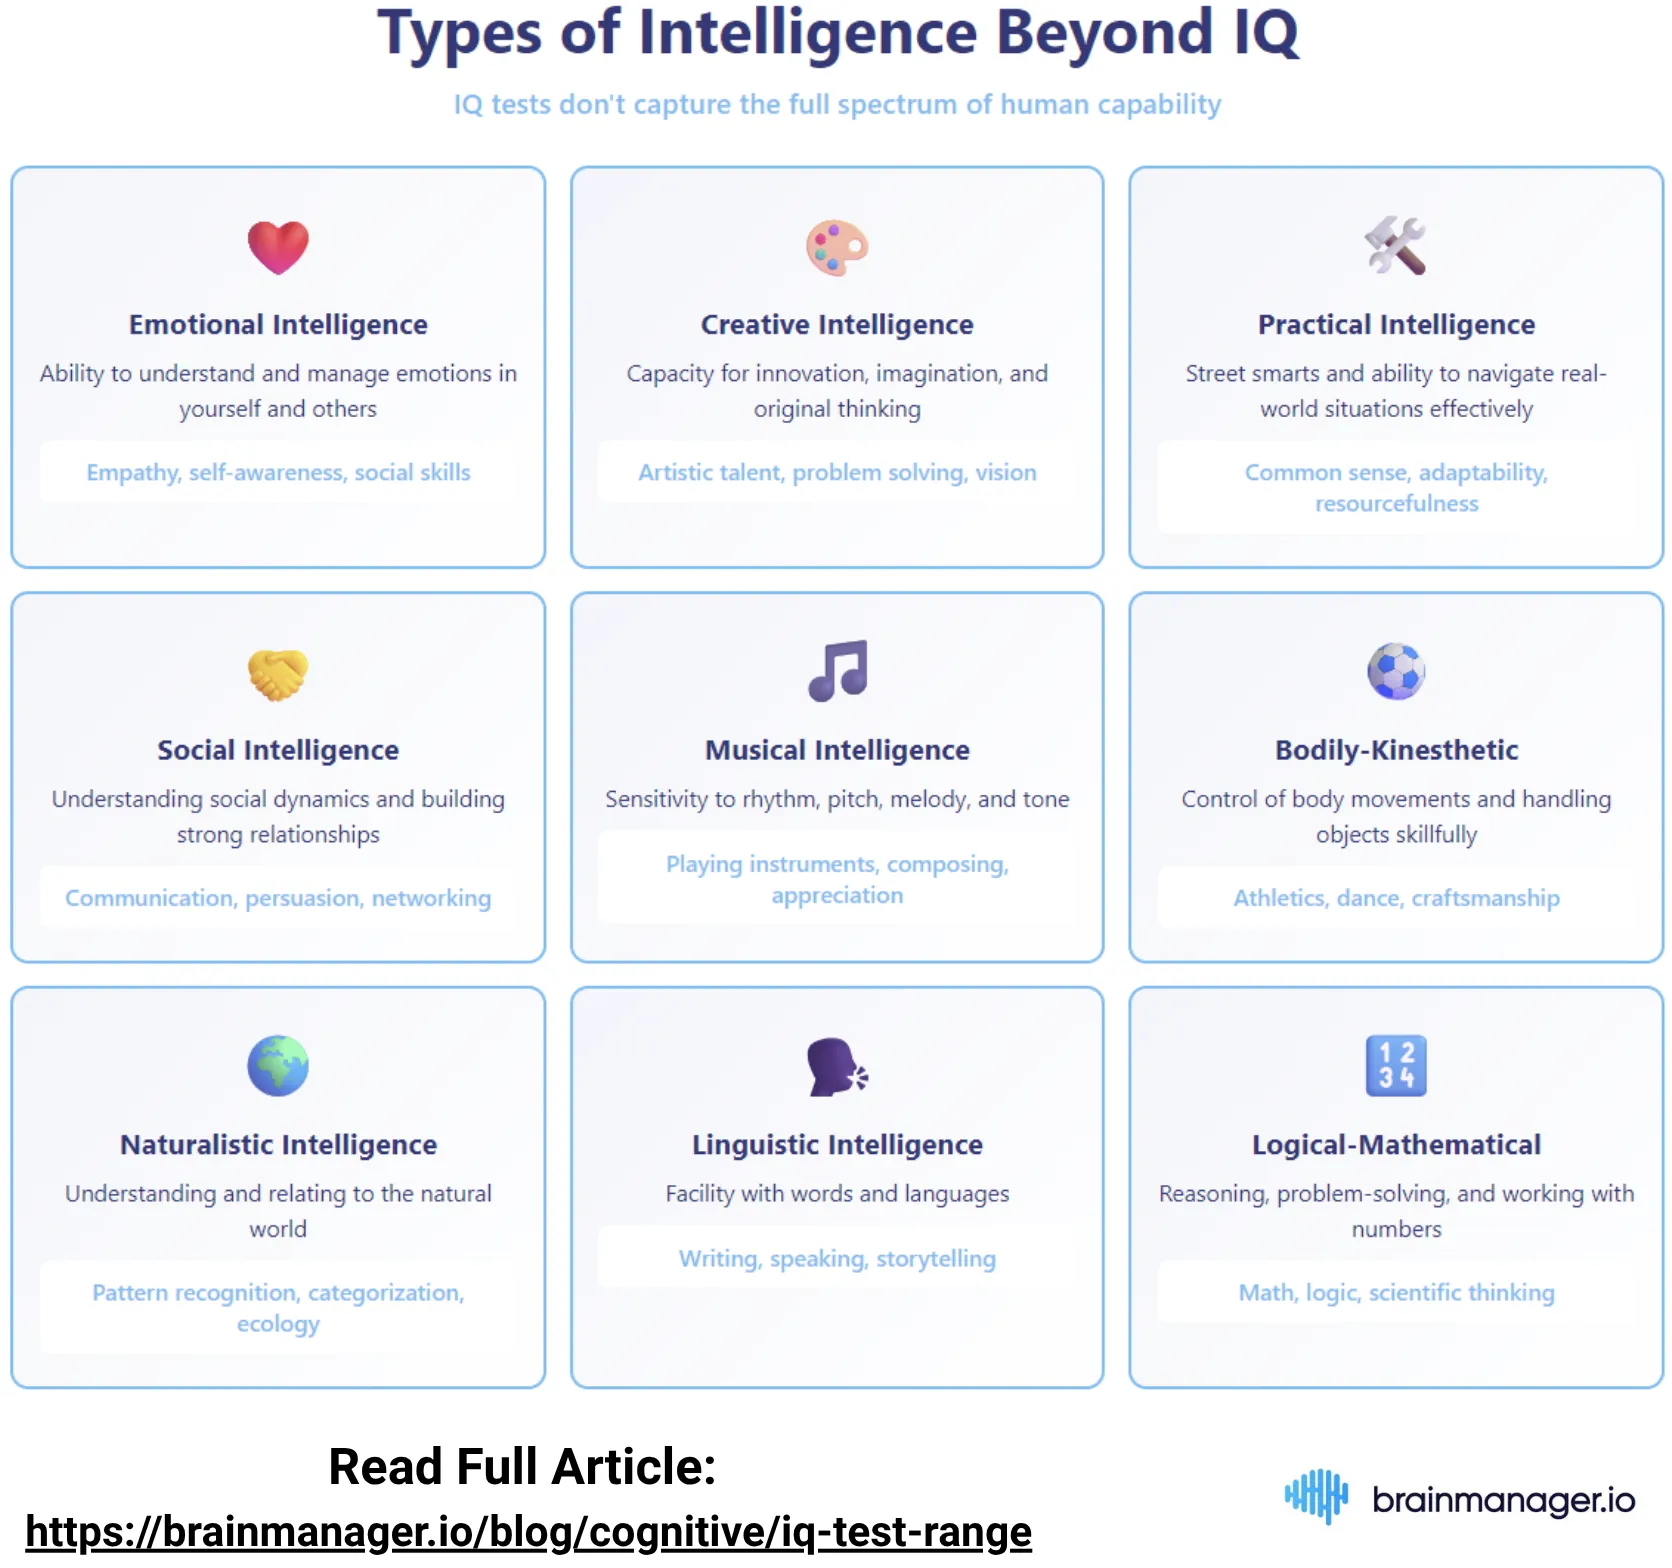
While IQ scores can provide valuable insights, they should be considered part of a broader assessment of your abilities. Emotional intelligence, creative intelligence, practical intelligence, and other forms of human intelligence play crucial roles in your overall potential and success. Some studies even believe motivation plays a crucial role in IQ functioning.
For a more comprehensive understanding of intelligence, you may also find it helpful to explore topics such as Gardner's Multiple Intelligences, Sternberg's Triarchic Theory of Intelligence, or the history and evolution of intelligence testing.
So, as you interpret your IQ score, remember that it's one piece of a much larger puzzle.
Embrace the strengths it reveals and use them as a guide to identify areas for growth and development. Ultimately, your intelligence is multifaceted and dynamic, shaped by a lifetime of learning and experiences.

Similar Articles
The Truth About Kanye West's IQ – And Why the Rapper's Genius Can’t Be Measured by a Test
Is Kanye West's IQ proof of his genius or just bold claims? Explore how his intelligence shapes his success in music, fashion, and beyond.
Understanding Logical-Mathematical Intelligence: Beyond 'Math Smart' – Developing Skills That Matter
Logical-mathematical intelligence is more than being good at math. Discover how problem-solving, critical thinking, and pattern recognition drive success.
Why Take an IQ Test? Use Your IQ Test Score for Self-Improvement
Why take an online IQ test? When you learn your IQ test score, it does not need to be only a number. Instead, think of it as a roadmap for self-development.

Do a self-diagnosis now
First and world's best testing platform. For everyone who has questions about themselves and wants answers too
Company BM
Vitosha Blvd 66, floor 4, 1463 Sofia
2026